This is the half nothing on a 96-dpi machine can answer, and the half the whole change is for. It needs a monitor at 150%.
What should be true: XrmToolBox's own window is drawn at the real resolution and is sharp. Every tool in it is drawn exactly as it is today — the same size on screen, the same layout, and blurry, because Windows is stretching a 96-dpi drawing. The two live in one window and neither is the other.
Before you start
Windows → Settings → System → Display → Scale = 150%, then start XrmToolBox fresh (per-monitor apps pick up a change live, but a clean start removes the question).
Setup — the same sandbox build as #1
cd C:\Users\kk\Code\XrmToolBox
git checkout high-dpi-opt-in
& "C:\Program Files (x86)\Microsoft Visual Studio\2022\BuildTools\MSBuild\Current\Bin\MSBuild.exe" `
    XrmToolBox.sln -p:Configuration=Debug -m
.\XrmToolBox\bin\Debug\XrmToolBox.exe /overridepath:$env:TEMP\xtb-dpi-sandbox
1. Two minutes of sanity first
Run the spike, which is the same mechanism in twenty lines and no XrmToolBox around it:
C:\Users\kk\Code\xrm-icons\tools\dpi-spike\run.ps1
At 100% the three windows are identical apart from what they say:
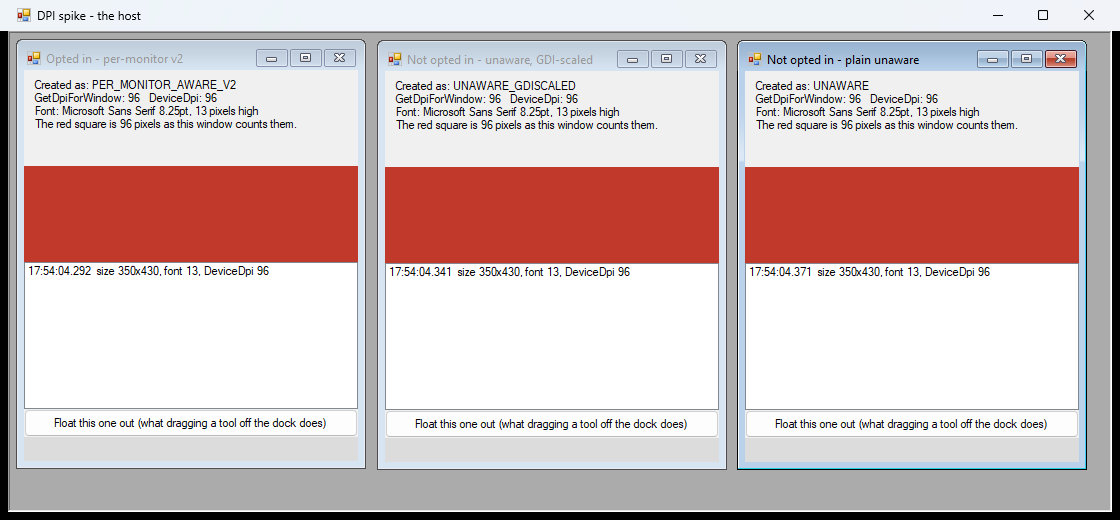
At 150% they must not be. The left one is aware, so its red square should measure 144 real pixels and its text should be sharp. The middle and right ones are unaware, so their squares should measure 96 and their text should be visibly softer. If all three look the same at 150%, the mechanism is not working on this machine and nothing below is worth doing.
2. The shell should be sharp
3. A tool should look exactly as it does today
Open the sample tool, and one or two real tools if you have them installed.
4. The two things I could not test at 96 dpi
(a) Double scaling on a DPI change. Drag the XrmToolBox window from the 150% monitor to a 100% one and back (needs two monitors at different scales).
If the tool visibly re-lays itself when the window changes monitor, WinForms is scaling it and Windows is stretching it — the promise that tools are unchanged is broken and I need to suppress the framework's pass for unaware tools.
(b) Floating. Drag a tool out of the dock into its own window.
(Measured at 96 dpi: the float window is PER_MONITOR_V2 and the tool inside it stays UNAWARE. What that looks like is the open question.)
Reading the machine's answer, not just the screen
With XrmToolBox running and a tool open:
C:\Users\kk\Code\xrm-icons\tools\dpi-spike\bin\WindowProbe.exe XrmToolBox
Expected, and what it prints on this branch at 96 dpi:
XrmToolBox (nnnnn) - the process is PER_MONITOR_AWARE

PER_MONITOR_V2   96 dpi  ...  "XrmToolBox for Microsoft Dataverse ..."
  UNAWARE        96 dpi  ...  "A Sample Tool (Not connected)"
  UNAWARE        96 dpi  ...  (every control in the tool)
At 150% the numbers should read 144 dpi for the shell's window and 96 dpi for the tool's.
What to report
Screenshots at 150% of anything that looks wrong, and the probe's output alongside. A screenshot of the whole screen is more useful than one window here — the point is how the two parts sit together.
This is the half nothing on a 96-dpi machine can answer, and the half the whole change is for. It needs a monitor at 150%.
What should be true: XrmToolBox's own window is drawn at the real resolution and is sharp. Every tool in it is drawn exactly as it is today — the same size on screen, the same layout, and blurry, because Windows is stretching a 96-dpi drawing. The two live in one window and neither is the other.
Before you start
Windows → Settings → System → Display → Scale = 150%, then start XrmToolBox fresh (per-monitor apps pick up a change live, but a clean start removes the question).
Setup — the same sandbox build as #1
1. Two minutes of sanity first
Run the spike, which is the same mechanism in twenty lines and no XrmToolBox around it:
At 100% the three windows are identical apart from what they say:
At 150% they must not be. The left one is aware, so its red square should measure 144 real pixels and its text should be sharp. The middle and right ones are unaware, so their squares should measure 96 and their text should be visibly softer. If all three look the same at 150%, the mechanism is not working on this machine and nothing below is worth doing.
2. The shell should be sharp
3. A tool should look exactly as it does today
Open the sample tool, and one or two real tools if you have them installed.
4. The two things I could not test at 96 dpi
(a) Double scaling on a DPI change. Drag the XrmToolBox window from the 150% monitor to a 100% one and back (needs two monitors at different scales).
If the tool visibly re-lays itself when the window changes monitor, WinForms is scaling it and Windows is stretching it — the promise that tools are unchanged is broken and I need to suppress the framework's pass for unaware tools.
(b) Floating. Drag a tool out of the dock into its own window.
(Measured at 96 dpi: the float window is
PER_MONITOR_V2and the tool inside it staysUNAWARE. What that looks like is the open question.)Reading the machine's answer, not just the screen
With XrmToolBox running and a tool open:
Expected, and what it prints on this branch at 96 dpi:
At 150% the numbers should read
144 dpifor the shell's window and96 dpifor the tool's.What to report
Screenshots at 150% of anything that looks wrong, and the probe's output alongside. A screenshot of the whole screen is more useful than one window here — the point is how the two parts sit together.